I am running the latest beta release (5.340.0 (4957)) on both my iPad (8th gen) and MacBook Pro (15" 2016).
Now what version I’m running doesn’t really seem to matter much as I have been having this issue for months now. Any time I am working on any design on my MacBook, Shapr3D will completely lockup for a solid 1-2min every time I select an assembly in the left hand menu, or by double clicking.
However I have had no issues whatsoever with the same designs on my iPad, everything runs perfect.
It’s hard to give a lot of specifics because this issue has persisted over several different versions, and happens with every design I have. The only reason I didn’t post about it before is because I was busy with non-CAD related work so it was pretty low on my priority list.
I have already tried removing shapr3d and re-installing from TestFlight and the issue is still exactly the same. I had the exact same issue with the stable release as-well, plus I wasn’t able to open my newest projects because of the version mismatch.
What I don’t understand though is when I first signed up for Shapr3D I didn’t have this issue at all and I was dealing with significantly larger assemblies than I am now. I also monitored my CPU and RAM usage when it would happen and my MacBook is barely breaking a sweat.
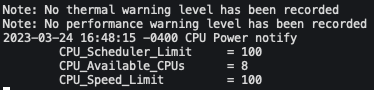
I cant think of a way to upload everything running as that is a TON of background processes. But When I took these screenshots, Shapr3D is open and has a design loaded, I also have Orion (web browser) open with 2 windows and around 30tabs, along with Messages, Email, VSCode, and iTerm. Everything else is background processes or small menubar apps like DockView, Moom, and MountainDuck. There is no single process, including Shapr, using more than 4% CPU except Orion which will occasioanlly jump upto to between 8-10%
These next 2 screenshots I took during Shapr3D being frozen after I selected a small assembly and clicked the “Align” tool.